
 VN
VN
 EN
EN
26/07/2026, 02:00
Investment
Stock Market Weekly Forecast: VN-Index may experience a tug-of-war
The VN-Index may experience a tug-of-war with alternating increases and decreases.
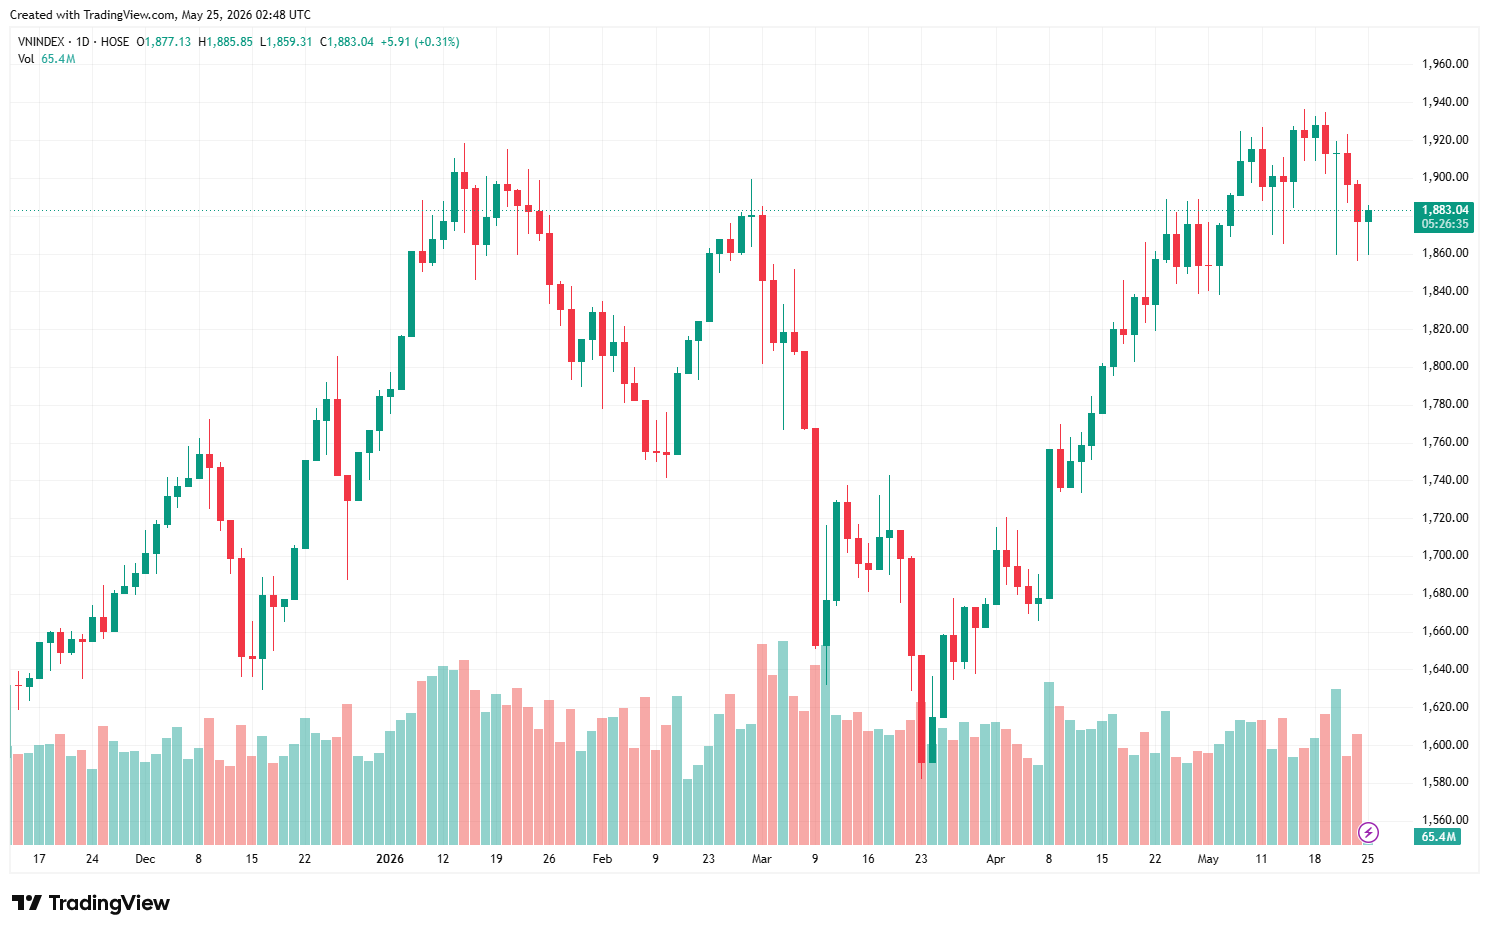
For the last week, the VN-Index decreased by 44.47 points (-2.31%).
The VN-Index experienced the last week with consecutive downward corrections from its historical peak of 1,920-1,940 points to the support area of 1,860-1,880 points. The reds dominated most sessions of the week with strong divergence in performance. Large-cap stocks that significantly influence the VN-Index, such as Vingroup’s stocks and banking ones, also saw predominantly downward movements.
Liquidity decreased sharply in the last two sessions of the week, reflecting cautious market sentiment. Along with domestic capital outflows, foreign investors also extended their net selling streak with a total net value exceeding VND3,000 billion, focusing heavily on selling MBB and ACB.
The VN-Index opened the final session of the week in the red and remained in a downward trend throughout the morning trading session. The downward correction in blue-chip stocks, particularly Vingroup shares, put significant pressure on the VN-Index and contributed to the market's negative sentiment. Foreign investors continued their net selling trend, with a total net selling value of VND 1,706 billion in the morning session alone.
In the afternoon session, strong buying pressure and a relatively positive recovery in many stocks helped the VN-Index narrow its decline somewhat. The securities sector was a bright spot, with VND showing a significant increase. At the close of trading, the VN-Index closed at 1877.13 points, down 19.76 points, or 1.04%. For the last week, the VN-Index decreased by 44.47 points (-2.31%) compared to the previous week.
The VN-Index closed the session with a hammer candlestick pattern thanks to the emergence of buying pressure in the afternoon. On the daily chart, the VN-Index showed signs of recovery after correcting to the important support zone of 1850-1860 points. Although the RSI and MACD indicators are still trending downwards, the fact that the CMF indicator continues to remain in the high zone suggests that active buying pressure is stable and expectations are high for the VN-Index to stabilize around 1,850 points.
On the hourly chart, the VN-Index has moved back into the Bollinger band, and the MFI indicator is trending upwards, further reinforcing the 1,860-point support level. The -DI line is reversing downwards while the DI line is rising, so it is highly likely that the VN-Index will experience a tug-of-war with alternating increases and decreases to test supply and demand in the 1,860-1,880 point area.
The market recorded a week of corrective movement towards the support zone around 1,850 points after showing signs of difficulty at the old peak of 1,920-1,940 points. However, a positive point is that buying pressure still shows effort to support and participate when the VN-Index retreats to 1,850-1,860 points. Furthermore, many stocks/market sectors continue to trade sideways and accumulate at low price levels, thus opening up attractive investment opportunities.
VCBS recommended that investors pay attention to portfolio risk management in the coming sessions given the current large intraday volatility and may also look for exploratory investment opportunities in stocks that are attracting strong demand compared to the overall market and show signs of rebounding after a long period of sideways consolidation during VN-Index fluctuations this week.
Author: NGOC ANH
RECOMMENDED TOPICS