
 VN
VN
 EN
EN
25/07/2026, 02:38
Investment
Stock Market Weekly Forecast: VN-Index may go sideways before a breakthrough
The VN-Index may fluctuate to test supply and demand near the resistance level and gain momentum before continuing its breakout.

Investors should consider investing in equities that are generating active cash flows and have strong upside potential compared to their most recent peaks
Over the previous week, the Vietnamese stock market has seen heavy net selling pressure from the opening session, dropping to the 1870-point level. Widespread selling pressure and lacklustre demand drove the VN-Index down in the third and fourth sessions, falling through 1,800 points.
However, bargain-hunting purchasing in banking and Vingroup stocks over the final two trading sessions of the week aided the market's robust recovery, reaching the 1840-point level. Last week, foreign investors sold a net total of VND 7,542 billion, up more than VND 3,140 billion from the previous week.
The VN-Index soon recaptured the 1,840-point threshold on last week's opening day due to robust bargain-hunting demand from Vingroup stocks and the banking sector. However, profit-taking pressure grew in the oil and gas sector, as well as several large-cap companies like FPT, MSN, and MWG. This morning's highlight was the banking sector, which saw large increases from SHB (1.45%), TPB (1.88%), and MSB (1.37%).
The VN-Index ended the morning session at 1,844.8 points, up 13.31 points from the previous level. The bullish trend persisted into the afternoon session, thanks to significant buying pressure from Vingroup stocks, and the surprise spike in VJC shares following the ATC session helped the VN-Index stabilise at 1,840 points in the second part of the day.
However, increasing profit-taking pressure in the final 30 minutes of the day and during the ATC session resulted in minor swings in the VN-index. Notably, foreign investors reverted to net purchasing in today's trading session, totalling more than 306.80 billion VND, with a focus on VIC, ACB, and FPT stocks.
The VN-Index finished the last week at 1,838.90 points, up 7.35 points, or 0.40%. It declined by 24.59 points (-1.23%) from the previous week.
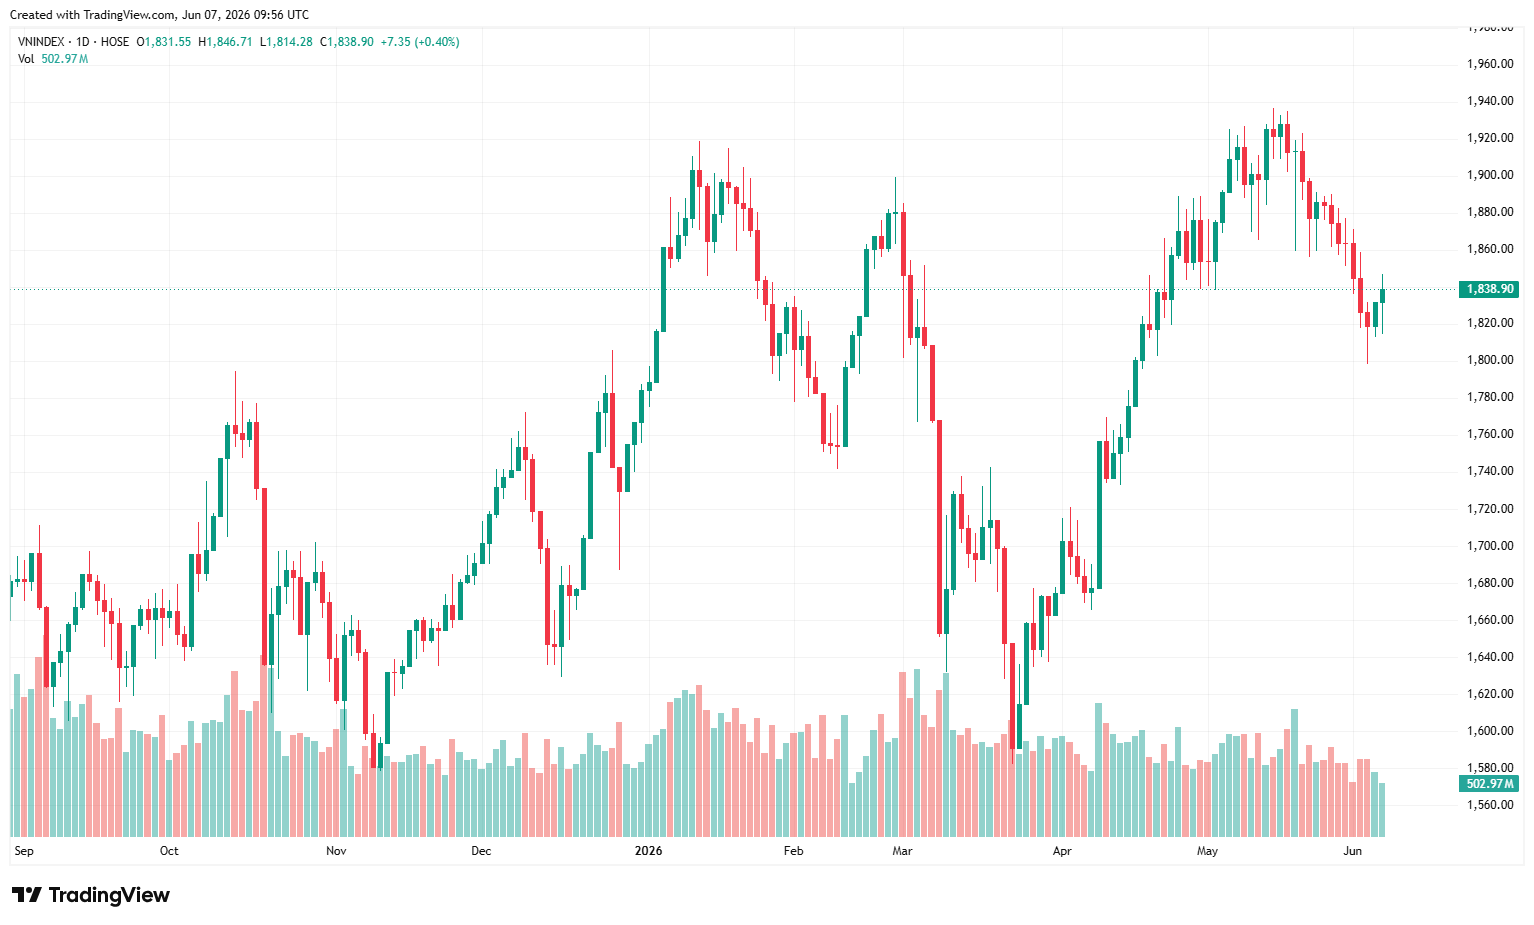
The VN-Index closed the last week with an inverted hammer candlestick, up roughly 1,840 points
The VN-Index closed the last week with an inverted hammer candlestick, up roughly 1,840 points. On the daily chart, technical indicators such as RSI and CMF are slowly regaining upward momentum, indicating that aggressive purchasing is returning to the market. The VN-Index is approaching the 1,860-1,870 point range and may encounter some volatility to test supply and demand at this resistance level and gain momentum before continuing its breakout.
On the hourly chart, the VN-Index continues to rise and remains around the upper border of the Bollinger band. Technical indicators are also showing an upward trend, so if this trend continues in the next sessions, the VN-Index's immediate goal will be the resistance zone at the previous top, which is approximately 1,870 points.
Vingroup's stocks continue to play an important role in the VN-Index's recovery. However, capital flows are highly diversified, with the majority concentrated in large-cap equities and only a few in mid- and small-cap stocks. As a result, VCBS suggests that investors should consider investing in equities that are generating active cash flows and have strong upside potential compared to their most recent peaks, but caution is advised when approaching past peaks to prevent potential short-term declines. Banking and securities are two potential areas to monitor.
Author: NGOC ANH
RECOMMENDED TOPICS