
 VN
VN
 EN
EN
15/07/2026, 10:39
Investment
Stock Market Daily Forecast: Leveraging intraday volatility for short-term trading
VCBS recommended that investors prioritize taking advantage of intraday fluctuations for short-term trading of stocks already in their portfolios.
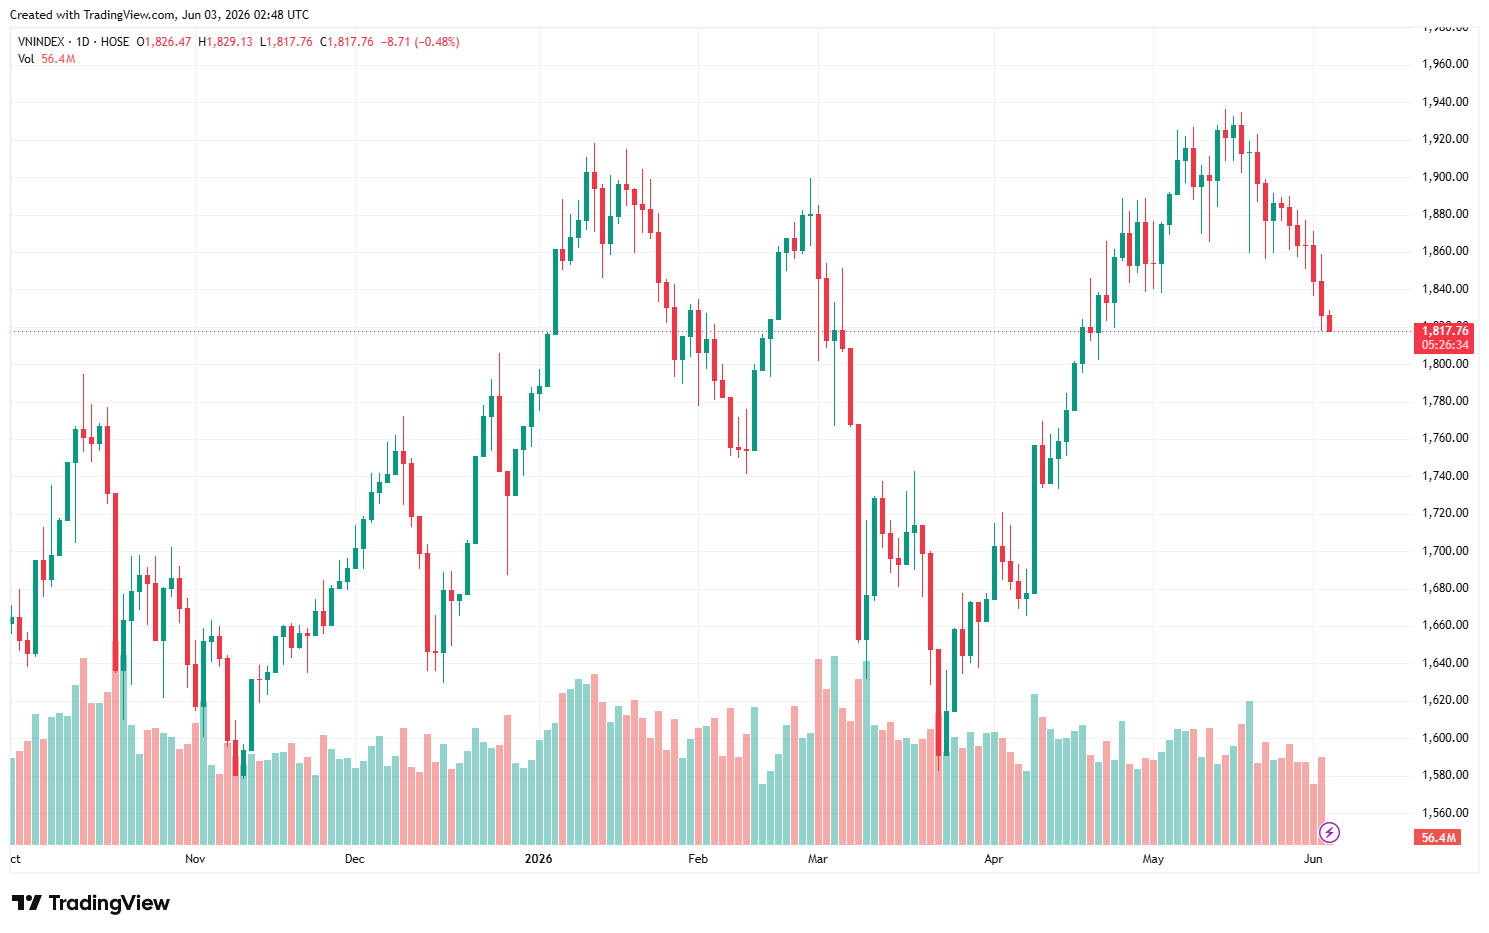
At the close of yesterday's session, the VN-Index closed at 1,826.47 points, down 18.07 points, or 1.43%.
In yesterday morning's trading session, the VN-Index rose and surpassed 1,850 points in the first half thanks to strong demand in Vingroup’s stocks and the gains of some other large-cap stocks.
However, selling pressure gradually returned strongly in the remainder of yesterday morning's session, especially in Vingroup’s stocks, causing the VN-Index to reverse and fall below 1,840 points. Foreign investors continued to heavily net sell this morning with a total net value of VND 370.20 billion, focusing on selling CTG, ACB, and HPG. At the end of the morning session, the general index closed at 1,836.10 points, down 8.44 points from the reference point.
In the afternoon session, widespread profit-taking pressure spread to key sectors such as banking, oil & gas, and real estate, directly pulling the VN-Index down from the psychological support level of 1,830 points. In the last 30 minutes of the trading session and during the ATC session, selling pressure intensified, causing the VN-Index to quickly lose the 1,820-point mark. Red dominated the market with 241 declining stocks, coupled with a surge in liquidity, indicating that sellers remained the dominant force.
Foreign investors continued their strong net selling in today's trading session, with a total net value of VND 543.19 billion, focusing on selling HPG, HDB, and ACB. At the close of yesterday's session, the VN-Index closed at 1,826.47 points, down 18.07 points, or 1.43%.
The VN-Index closed today's trading session with a bearish high-wave candlestick pattern, featuring a long upper wick and a short lower wick, along with slightly higher trading volume compared to the 20-day average, indicating that supply is still overwhelming demand at the bottom.
On the daily chart, the MACD and RSI indicators continue to trend downwards, reflecting the ongoing downtrend. Additionally, the CMF indicator continues to trend downwards, showing weakening money flow and suggesting the correction trend shows no signs of stopping, with short-term support expected around 1,800 points, equivalent to the market's MA50.
On the hourly chart, technical indicators also continue to trend downwards, but the RSI has entered the oversold zone; therefore, the VN-index is expected to experience a technical rebound in the next session. The nearest short-term resistance level, if a recovery trend emerges, will be the 1,850-point zone, equivalent to the MA20 line on the hourly chart.
The VN-Index recorded a 19-point correction yesterday. Simultaneously, cash flows continued to be clearly differentiated, with a few stocks showing signs of rebound after a correction, although the VN-Index has not yet reversed its downward trend. Therefore, VCBS recommended that investors closely monitor market developments in the coming sessions, exercise greater caution when opening new positions, and prioritize taking advantage of intraday fluctuations for short-term trading of stocks already in their portfolios.
Author: NGOC ANH
RECOMMENDED TOPICS