
 VN
VN
 EN
EN
15/07/2026, 10:39
Investment
Stock Market Daily Forecast: What market sectors to note?
Potential stock market sectors to note are banking, public investment, oil and gas, retail...

At the end of yesterday’s session, the VN-Index closed at 1,753.74 points, up 12.42 points, equivalent to 0.71%.
The VN-Index opened the first trading session of the week up 16 points compared to the reference thanks to strong demand from Vingroup stocks (VPL, VIC, VHM). Selling pressure focused mainly on banking and consumer stocks along with some individual stocks such as HPG and VJC.
However, on the contrary, some market sectors recorded the attention of cash flow, such as public investment and consumption, such as SAB hitting the ceiling, VNM (1.42%), HHV (1.04%) and CTD (2.96%). At the end of the trading session, the VN-Index recorded at 1755.49 points, up 14.17 points compared to the reference.
Entering the afternoon session, the VN-Index was under strong supply pressure from banking stocks, causing the VN-Index to lose the 1,750 mark at times. However, thanks to the continued demand in the Vingroup stocks, along with the strong increase in a few large caps (such as SAB and BVH hitting the ceiling or GAS increasing by more than 2%) at the end of the session, the VN-Index regained the 1,750 mark in the second half of the session.
Liquidity in the afternoon session decreased by 21% compared to the morning session, along with the fact that the market had 217 red codes, showing that selling pressure was still overwhelming the market as well as the cautious sentiment of investors in the period of lack of supporting information.
Foreign investors continued to sell strongly in today's trading session with a total value of 1,839.64 billion VND, focusing on selling VPL, GMD and VIC.
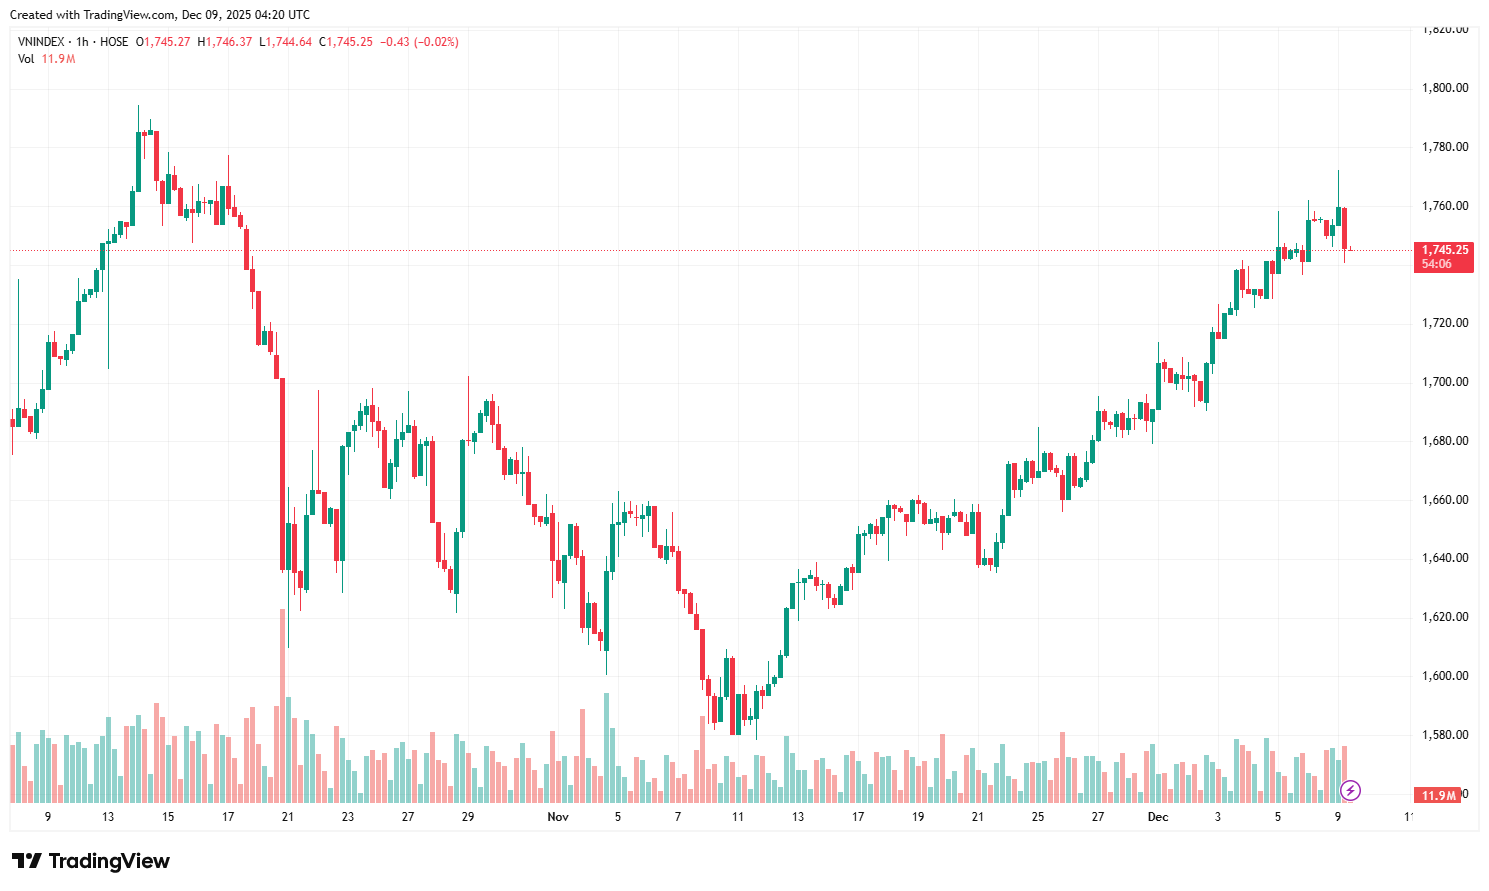
The VN-Index is in an uptrend.
At the end of yesterday’s session, the VN-Index closed at 1,753.74 points, up 12.42 points, equivalent to 0.71%.
The VN-Index ended the session with a hammer candlestick, mainly due to the strong demand maintained in Vingroup stocks.
On the daily chart, the VN-Index fluctuated within a small range to test supply and demand around the 1,750-1,760 point area. The CMF indicator pointed up, showing that active cash flow was dominating the market. Accordingly, the VN-Index was expected to soon conquer the 1,770-point mark, equivalent to the 0.618 mark of the extended Fibonacci scale.
On the hourly chart, the RSI indicator pointed down slightly after entering the overbought zone, while the MACD indicator was flat, so the increase of the VN-Index may slow down, especially when it is approaching the old peak around 1,770, so it is likely that it will need to test supply and demand to consolidate momentum in the 1,760-1,770 range in the next sessions.
The growth of Vingroup stocks, especially VIC, is still the main driving force helping the VN-Index maintain its upward trend. However, cash flow is still highly differentiated among market sectors, with most of the cash flow focused on large caps and a few other small- and medium-cap stocks.
In the current market context, in VCBS’s view, investors can consider investing in stocks that are attracting active cash flow and have more room to increase in price compared to the most recent old peak, while being cautious with stocks that are approaching the old peak to avoid short-term corrections that may occur when the VN-Index approaches the old peak of 1,770 in the coming sessions. Potential market sectors to note are banking, public investment, oil and gas, and retail.
Author: NGOC ANH
RECOMMENDED TOPICS