
 VN
VN
 EN
EN
26/07/2026, 11:20
Investment
Stock Market Daily Forecast: Will the VN-Index continue its rebound?
The VN-Index may experience some fluctuations and accumulate more momentum before continuing its breakout.
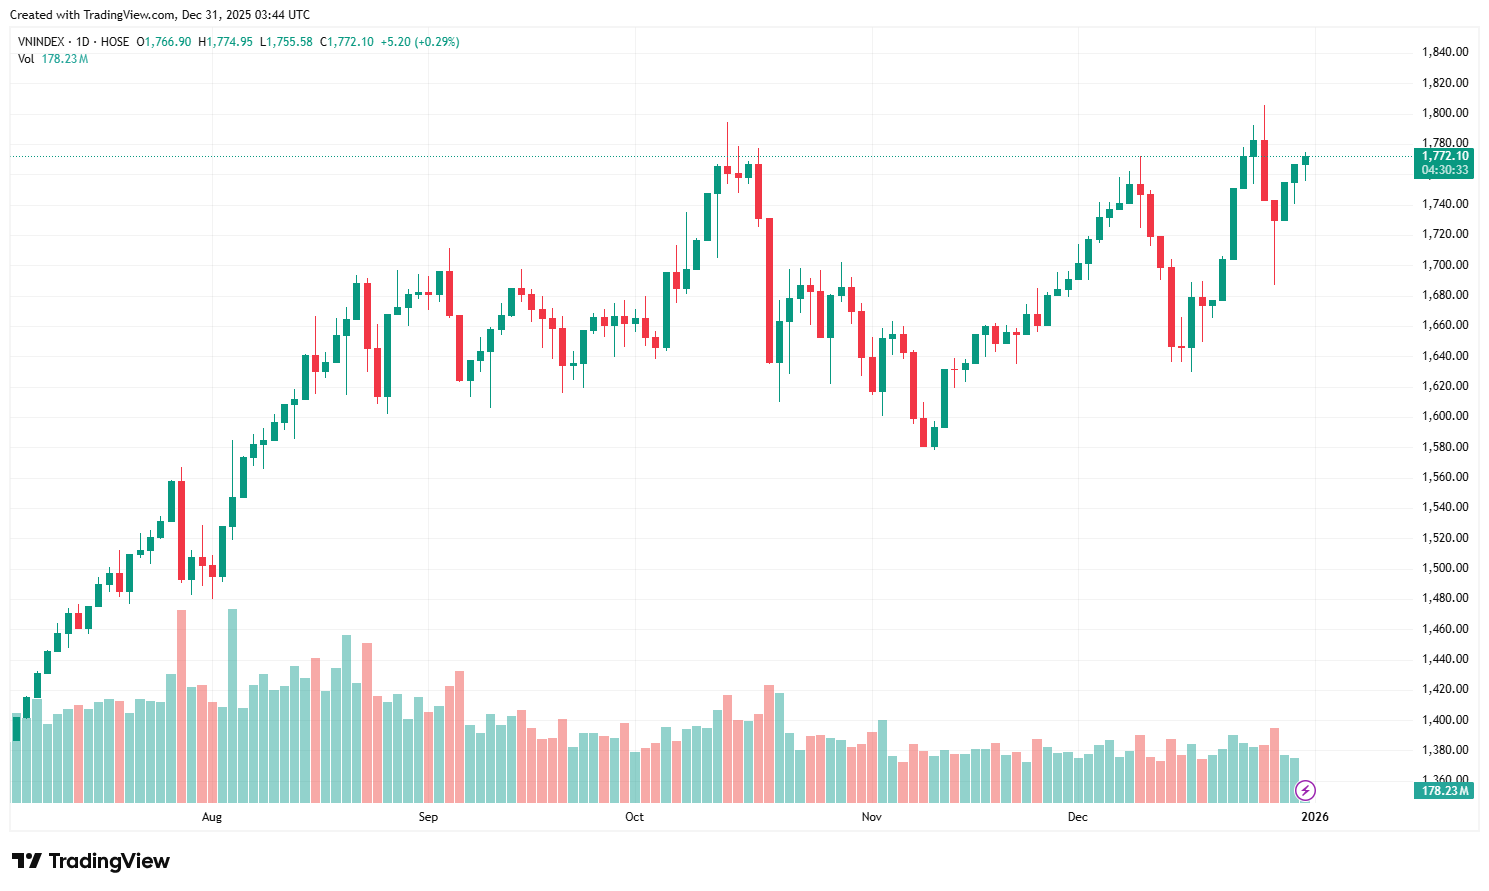
At the close of yesterday’s trading session, the VN-Index closed at 1,766.90 points, up 12.06 points, equivalent to 0.69%.
In yesterday's trading session, the VN-Index opened slightly higher thanks to the upswing of bank stocks but quickly fell below the reference level under increased selling pressure on Vingroup stocks. In the latter half of the trading session, the divergence between stocks caused the VN-Index to mostly fluctuate in the 1,750-1,760 point range.
Highlights of yesterday morning's trading session included strong gains in several large-cap stocks such as GVR (2.50%), DGC (2.62%), and BID (1.42%), along with some individual stocks like PHR (4.98%) and DPR (3.07%). At the end of yesterday morning's session, the VN-Index closed at 1,747.16 points, down 7.68 points from the reference point.
Entering the afternoon session, buying pressure quickly returned to the market from the opening, although it remained mainly concentrated in the banking sector and some large-cap stocks like MWG, DGC, and FPT. The upward trend continued as capital flowed back into Vingroup stocks, helping the VN-Index extend its gains.
However, the decrease in market liquidity compared to the previous session, coupled with the closing gains mainly formed after the ATC session and the overall market breadth being balanced between the number of rising and falling stocks, indicates market divergence and a relatively quiet trading atmosphere amidst the approaching New Year's holiday.
Foreign investors reversed to buying during today's trading session with a total transaction value of 999.96 billion VND, focusing on buying MWG, FPT, and STB.
At the close of yesterday’s trading session, the VN-Index closed at 1,766.90 points, up 12.06 points, equivalent to 0.69%.
The VN-Index closed with a green candle and above 1,760 thanks to strong buying pressure in large-cap stocks. On the daily chart, technical indicators such as MACD, RSI, and CMF are gradually regaining upward momentum, indicating that active buying is still being maintained. The VN-Index is on its way to the previous peak around 1,770-1,780 points and may experience some fluctuations to test supply and demand at this resistance level and accumulate more momentum before continuing its breakout.
On the hourly chart, after touching the MA20 support line, the VN-Index bounced up thanks to increased active buying liquidity at the end of the afternoon session. Accordingly, the MACD indicator has given a signal confirming the short-term recovery trend of the VN-Index after touching the short-term support line of 1,740 during the session.
The market is showing signs of a sideways phase, with the VN-Index fluctuating within a range of approximately 1,750 /- 20 points and liquidity somewhat lower than the 20-day average. Given that large-cap stocks have shown signs of recovery and are the main driving force behind the VN-Index's upward trend, VCBS recommends investors maintain their holdings in stocks currently available in their portfolios and recovering from support levels. Simultaneously, investors can also take advantage of speculative cash flows and make exploratory investments in stocks attracting this capital during market fluctuations. Some notable sectors for the session include retail, consumer goods, and securities.
Author: NGOC ANH
RECOMMENDED TOPICS