
 VN
VN
 EN
EN
22/07/2026, 02:38
Investment
Will VN-Index continue its recovery on returning bottom-fishing demand?
Besides maintaining their holdings in stocks with strong upward trends, investors can look for opportunities to invest in sectors that are entering an uptrend or showing signs of recovery.
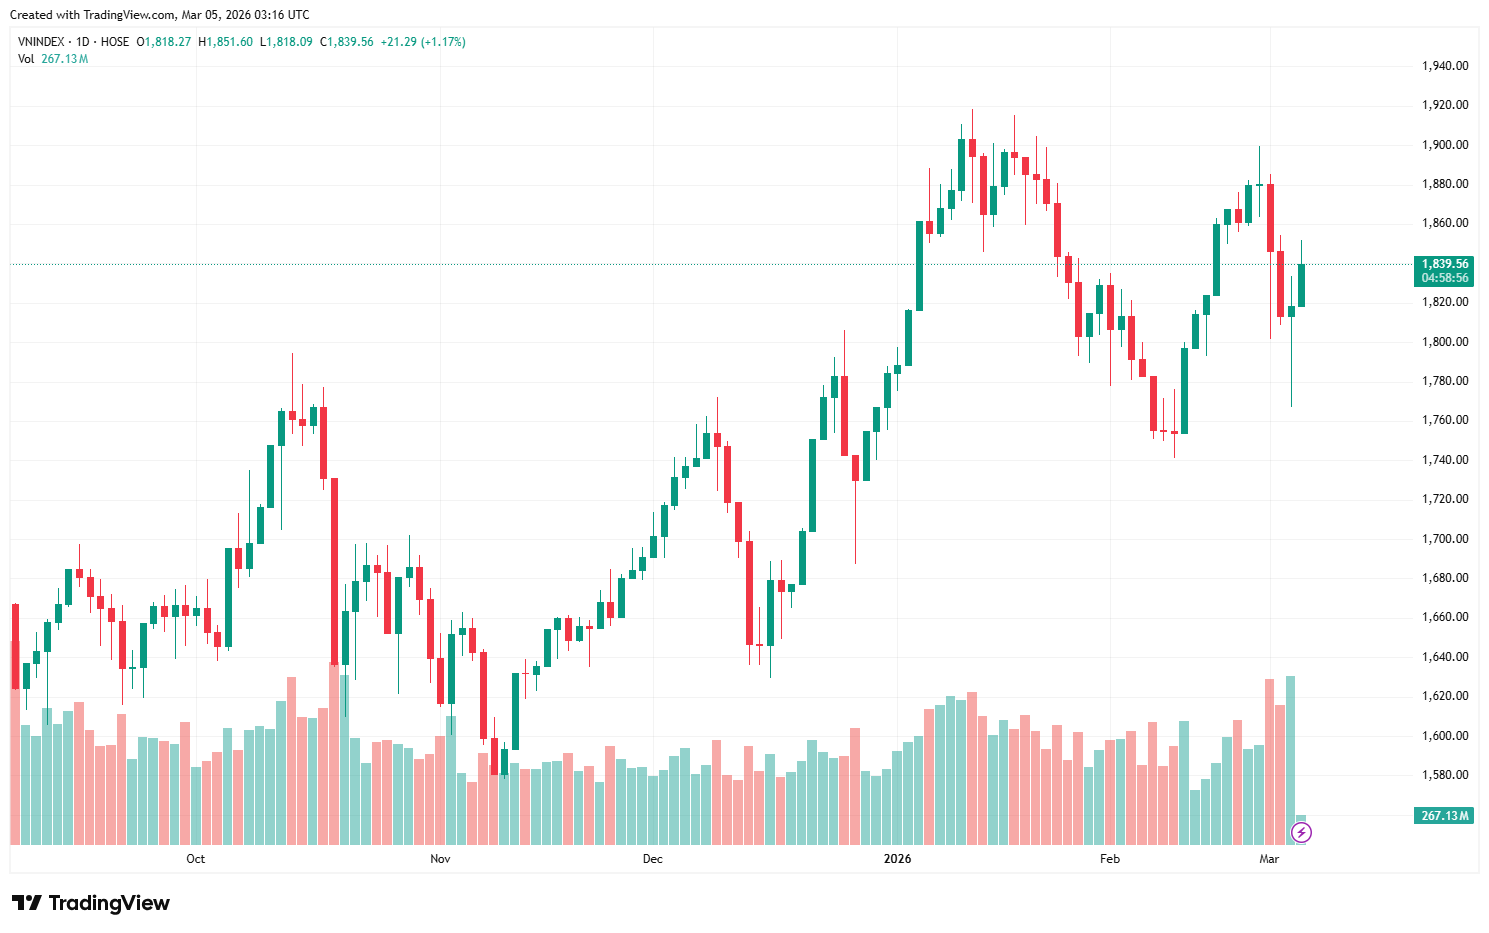
At the close of yesterday's trading session, the VN-Index closed at 1,818.27 points, up 5.13 points, equivalent to 0.28%.
At the opening of yesterday’s trading session on March 4th, the VN-Index fluctuated within a range of /- 20 points around the reference point for about an hour before moving entirely in the red for the remainder of the session. Active selling pressure continued to weaken the index, breaking through the support zone at 1,800 points with a drop of nearly 40 points compared to the reference point.
Statistically, the correction pressure was mainly concentrated on large-cap stocks such as VIC, VHM, TCB, and MWG. Conversely, the Oil and Gas sector acted as a rare bright spot, continuing to attract cash flows with GAS and PLX increasing by about 4%.
Entering the afternoon session, the VN-Index fell below 1,770 points in the first 30 minutes before gradually recovering and closing slightly above the reference point. The significant contribution to the overall score in the session was the narrowing of the decline and even reversal to gains in large-cap stocks such as the Vingroup stocks and the banking group (VCB, BID), along with the morning's gains in the oil and gas group. The securities group also recorded a positive recovery today, with VCI hitting the ceiling price and SSI and HCM both increasing by 3%. Liquidity today saw renewed growth with a total trading volume of VND 44 trillion.
At the close of yesterday's trading session, the VN-Index closed at 1,818.27 points, up 5.13 points, equivalent to 0.28%.
The VN-Index closed with a candlestick similar to a spinning top with a long wick, indicating significant market volatility. On the daily chart, the recovery session with high volume signals a positive reversal. On the RSI indicator, the signal line has stopped trending downwards, and the CMF indicator has started trending upwards again, indicating that demand has increased.
On the hourly chart, the VN-Index closed above the lower band of the Bollinger Band, showing the strength of the buyers. Simultaneously, the RSI indicator, after touching the oversold region, reversed upwards, further reinforcing the index's recovery in the next session. The VN-Index may continue to trend upwards, with the nearest resistance level at 1,850 points.
The market is showing signs of recovery and stabilization after two sessions of sharp declines amidst ongoing political instability in the Middle East. Given the current developments, VCBS recommends that investors continue to closely monitor market movements. Besides maintaining their holdings in stocks with strong upward trends, investors can look for opportunities to invest in sectors that are entering an uptrend or showing signs of recovery after significant price drops. Some sectors to watch include securities, steel, and consumer goods.
Author: NGOC ANH
RECOMMENDED TOPICS