
 VN
VN
 EN
EN
22/07/2026, 02:38
Investment
Stock Market Weekly Forecast: Divergence among market sectors may continue
The VN-Index could continue to experience alternating periods of gains and losses, with divergence among market sectors.
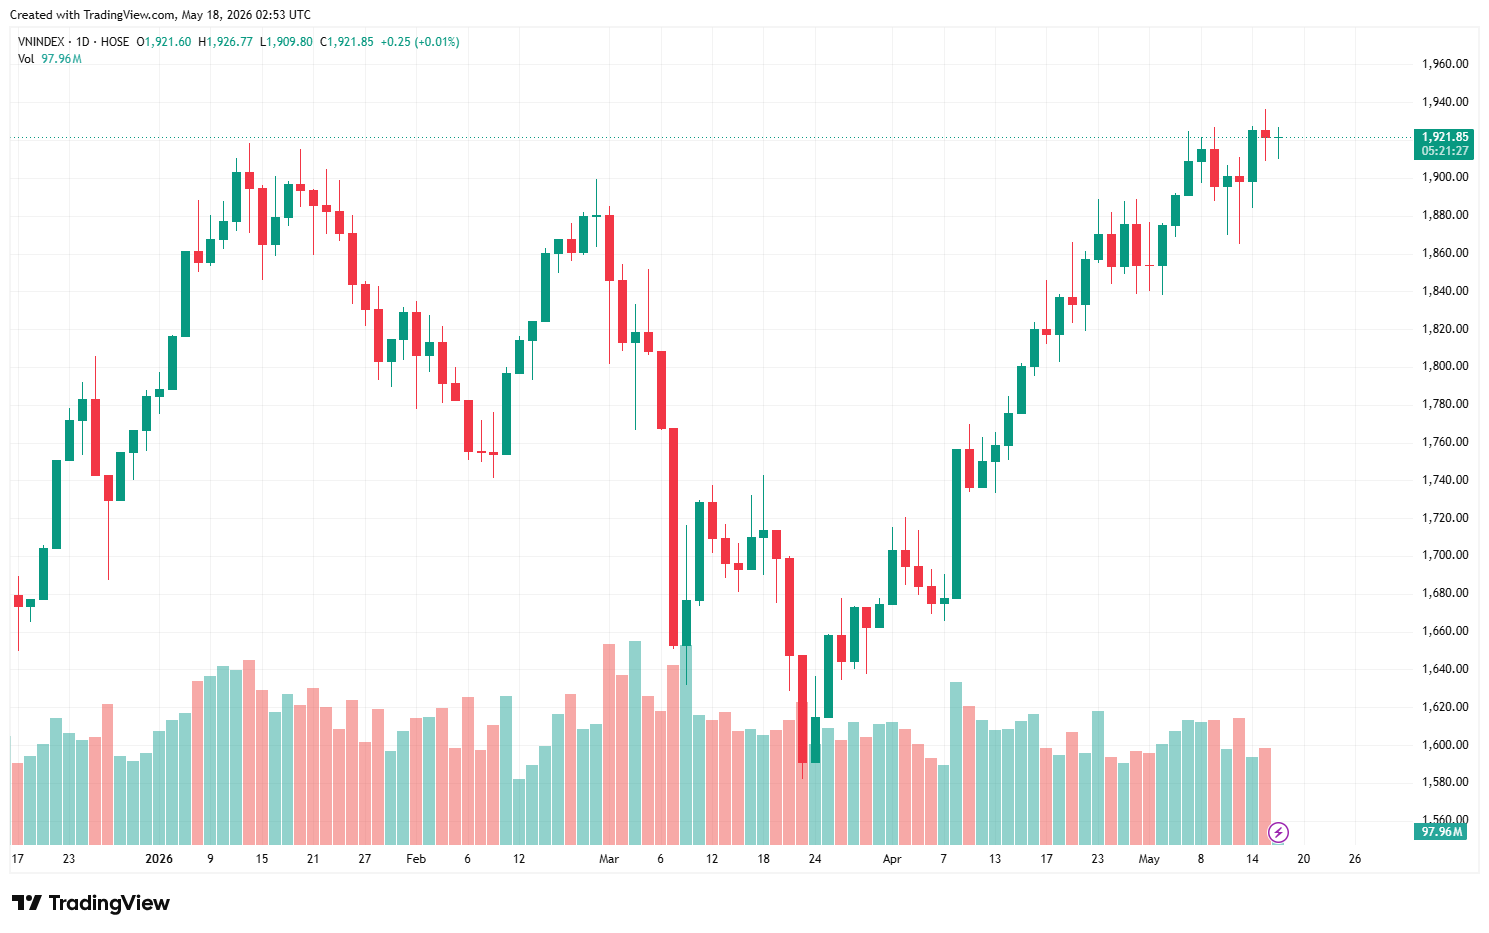
At the close of last week's trading session, the VN-Index closed at 1921.6, down 3.86 points, or 0.2%.
During the trading week of May 11-15, the VN-Index experienced wide-ranging fluctuations after returning to the previous peak area of 1,900-1,920. Liquidity tended to decrease during the week, accompanied by a divergence in cash flows, indicating a cautious sentiment in the market.
Foreign investors were also predominantly net sellers with a total net value of over 3,860 billion VND, focusing on selling some blue-chip stocks such as VHM, FPT, and ACB. However, thanks to the banking and oil & gas sectors taking turns supporting the index, the VN-Index still maintained its score in the 1,900-1,920 area.
The VN-Index opened the final session of the week in positive territory, and after touching 1,930 points, the index began to slip and fluctuated within a range of approximately 10 points below the reference mark until the end of the morning session. Efforts in some blue-chip stocks in the banking sector such as TCB, LPB, ACB, and some individual stocks like GAS and NVL helped to balance the index and limit the decline during the session.
In the afternoon, strong selling pressure at the beginning of the session pushed the index below 1,910 points. Red dominated, but the gap narrowed towards the end of the session with 187 stocks in the red and 120 in the green. Towards the end of the afternoon, many blue-chip stocks recovered with narrowed declines, bringing the index closer to the reference level. Foreign investors sold heavily with a total net value of VND 809.07 billion, mainly selling HPG and VHM.
At the close of last week's trading session, the VN-Index closed at 1921.6, down 3.86 points, or 0.2%. At the end of the week, the VN-Index increased by 6.23 points (0.33%) compared to the previous week.
The VN-Index closed the session forming a hammer candlestick pattern thanks to buying pressure towards the end of the session on May 15th. On the daily chart, both momentum indicators, MACD and RSI, are in the high, sideways range, indicating that investors are still quite cautious at the previous peak. However, the Tenkan line, MA20, and CMF are still trending upwards, so the probability of a sharp and unexpected market correction is low.
On the hourly chart, the CMF, RSI, and MACD indicators are all trending upwards, and with the VN-Index still above the thin green Kumo cloud, it is highly likely that the market will continue to be volatile, with alternating increases and decreases in the short term before a new trend emerges.
Over the past week, the VN-Index experienced alternating periods of gains and losses, with divergence among market sectors, and remained close to its historical peak around 1920. Vingroup’s stocks continued to play a crucial role in keeping the index above 1,900. The alternating increases and decreases among stock groups indicate that capital is still flowing well and shows no signs of withdrawing from the market, making a sharp and unexpected correction at the peak unlikely.
VCBS recommends that investors continue to maintain their portfolio weighting and prioritize stocks in sectors that are attracting cash flows or maintaining sideways trading ranges, such as retail, banking, and oil and gas.
Author: NGOC ANH
RECOMMENDED TOPICS