
 VN
VN
 EN
EN
15/07/2026, 10:39
Investment
Stock Market Weekly Forecast: Wary of opening new positions
VCBS recommended that investors closely monitor market developments in the coming sessions, while being more cautious when opening new positions.

Investors done transactions at SSI
Over the past week, the Vietnamese stock market witnessed a strong tug-of-war between buyers and sellers around the 1,860-1,890 point range. Specifically, in the first half of the week, the market generally fluctuated within a large range of 1,860-1,890 points.
The market opened slightly higher in last week’s morning session, but profit-taking pressure quickly emerged. The VN-Index experienced a significant correction under pressure from banking stocks (VCB, BID, SHB) and large-cap stocks such as MWG, MSN, and BSR. The tug-of-war and strong divergence among stock sectors caused the VN-Index to mostly consolidate within a narrow range of 1,855-1,865 points.
At the end of the morning session, the VN-Index closed at 1,863.23 points, down slightly by 0.44 points from the reference point. In the afternoon session, the market saw a recovery effort thanks to increased demand in Vingroup stocks and the oil and gas sector, helping the VN-Index quickly break through and successfully conquer the 1870-point resistance level.
However, selling pressure returned in the last 30 minutes of the session and during the ATC session, causing the index to lose its earlier gains and fall slightly below the reference point. Notably, foreign investors continued their strong net selling trend with a total value exceeding VND 704.25 billion, focusing on selling CTG, VHM, and VPB stocks.
In the last two sessions of the week, selling pressure increased in banking and securities stocks, then spread to many other sectors, causing the VN-Index to continue to fall and retreat to the 1,855-point support level in the final trading session. Foreign investors sold net a total of VND 6,341 billion last week, an increase of over VND 5,783 billion compared to the same period the previous week.
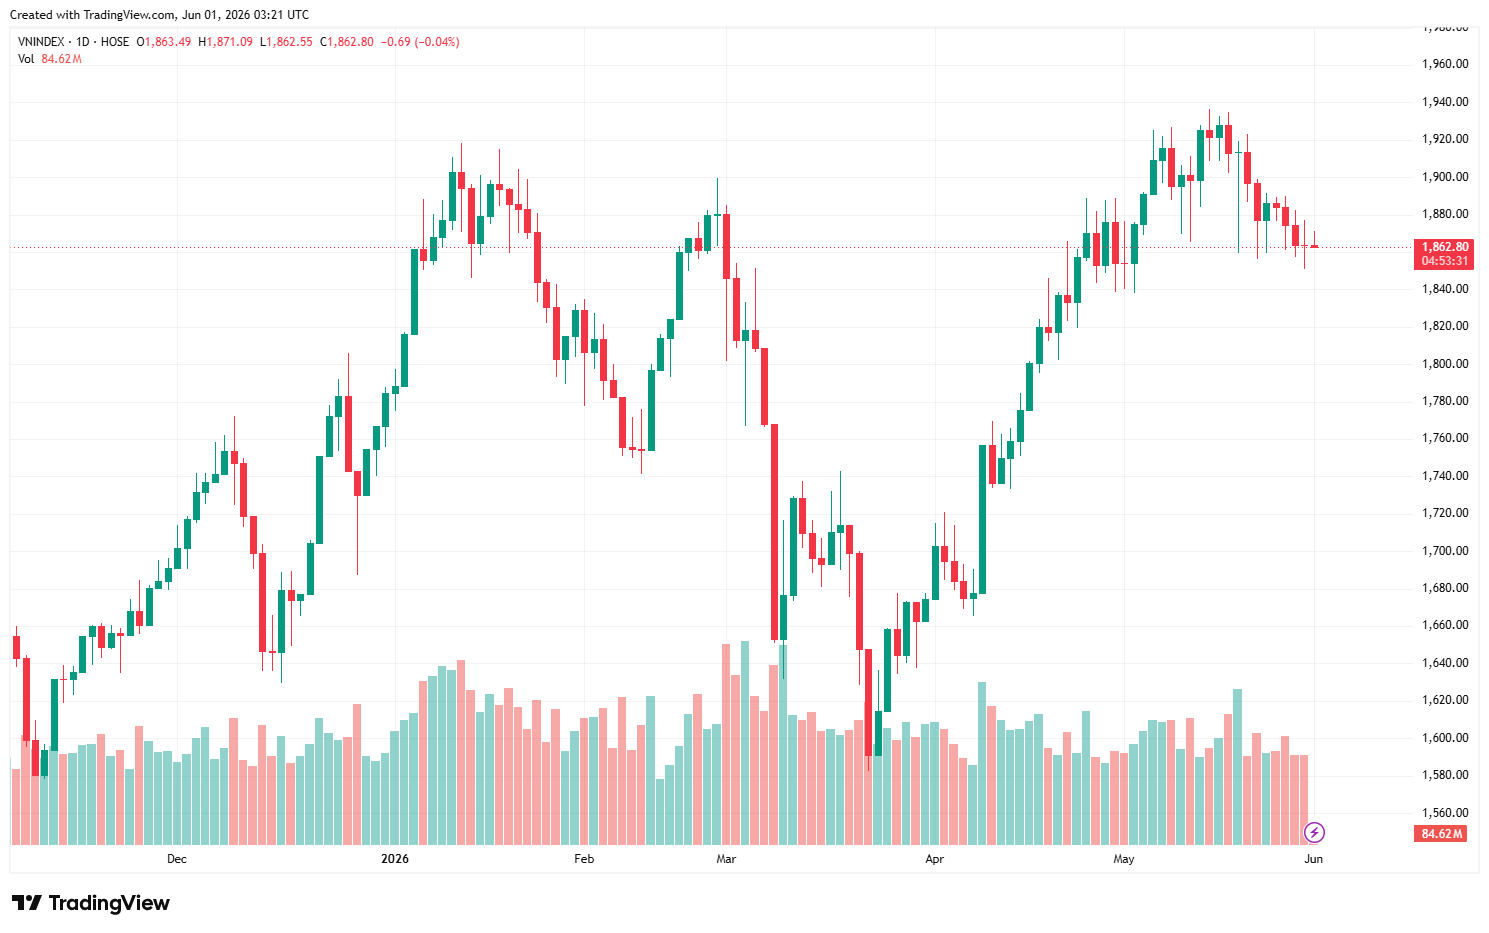
At the close of trading, the VN-Index closed at 1,863.49 points, down 0.18 points, or 0.01%. For the week, the VN-Index decreased by 13.64 points (-0.73%) compared to the previous week.
The VN-Index is moving sideways
The VN-Index closed last week's trading session with a doji candlestick and predominantly red, reflecting short-term selling pressure in the market. On the daily chart, technical indicators such as RSI and MACD generally began to break sideways after a period of downward correction, reflecting the short-term consolidation of the index around the 1,850-1,860 point range in recent sessions. Short-term support remains in the 1,840-1,850 point range, corresponding to the most recent previous low.
On the hourly chart, the VN-Index moved closely along the lower Bollinger band and showed some recovery in the afternoon session. Therefore, if the VN-Index continues its recovery in the coming sessions, the nearest resistance level will be 1,870 points.
The VN-Index is currently testing momentum around the 1,850-1,870 range. At the same time, cash flow continues to show a clear divergence between sectors, with some stocks beginning to show signs of rebounding after a downward correction. Accordingly, VCBS recommends that investors closely monitor market developments in the coming sessions while being more cautious when opening new positions and prioritizing taking advantage of intraday fluctuations for short-term trading purposes with stocks already in their portfolios.
Author: NGOC ANH
RECOMMENDED TOPICS