
 VN
VN
 EN
EN
26/07/2026, 02:00
Investment
Stock Market Daily Forecast: Waiting for the right time to invest
Many analysts recommended that investors should wait to invest when the overall market shows clear signs of equilibrium.
The VN-Index is in a downtrend.
Amidst escalating geopolitical crises, global financial markets in general and Vietnam in particular are experiencing significant impacts, resulting in heightened caution in general sentiment.
Continuing the downward trend from last week, the VN-Index opened the first session of the week with a gap of nearly 20 points and continued its decline throughout the morning session, pushing the index below the 1,600 mark. Red dominated the market, with 293 stocks falling and only 38 stocks maintaining gains. The biggest pressure on the index came from large-cap stocks (banking, securities, real estate, and retail), led by VHM (-6.1%), VIC (-1.65%), and HDB (- 3.8%).
In the afternoon session, the market continued to fluctuate around the 1,600 mark with widespread selling pressure and a narrower range of gains compared to the morning session. Several blue-chip stocks, such as VIC, MWG, GVR, and DGC, hit their floor prices. Simultaneously, many stocks on the market lost important support levels and continued to search for bottoms. Liquidity remained lower than the 20-day average, indicating that capital flows are slowing down and observing. In line with domestic investors, foreign investors net sold a total of VND 512.91 billion, focusing on selling MWG, STB, and VHM.
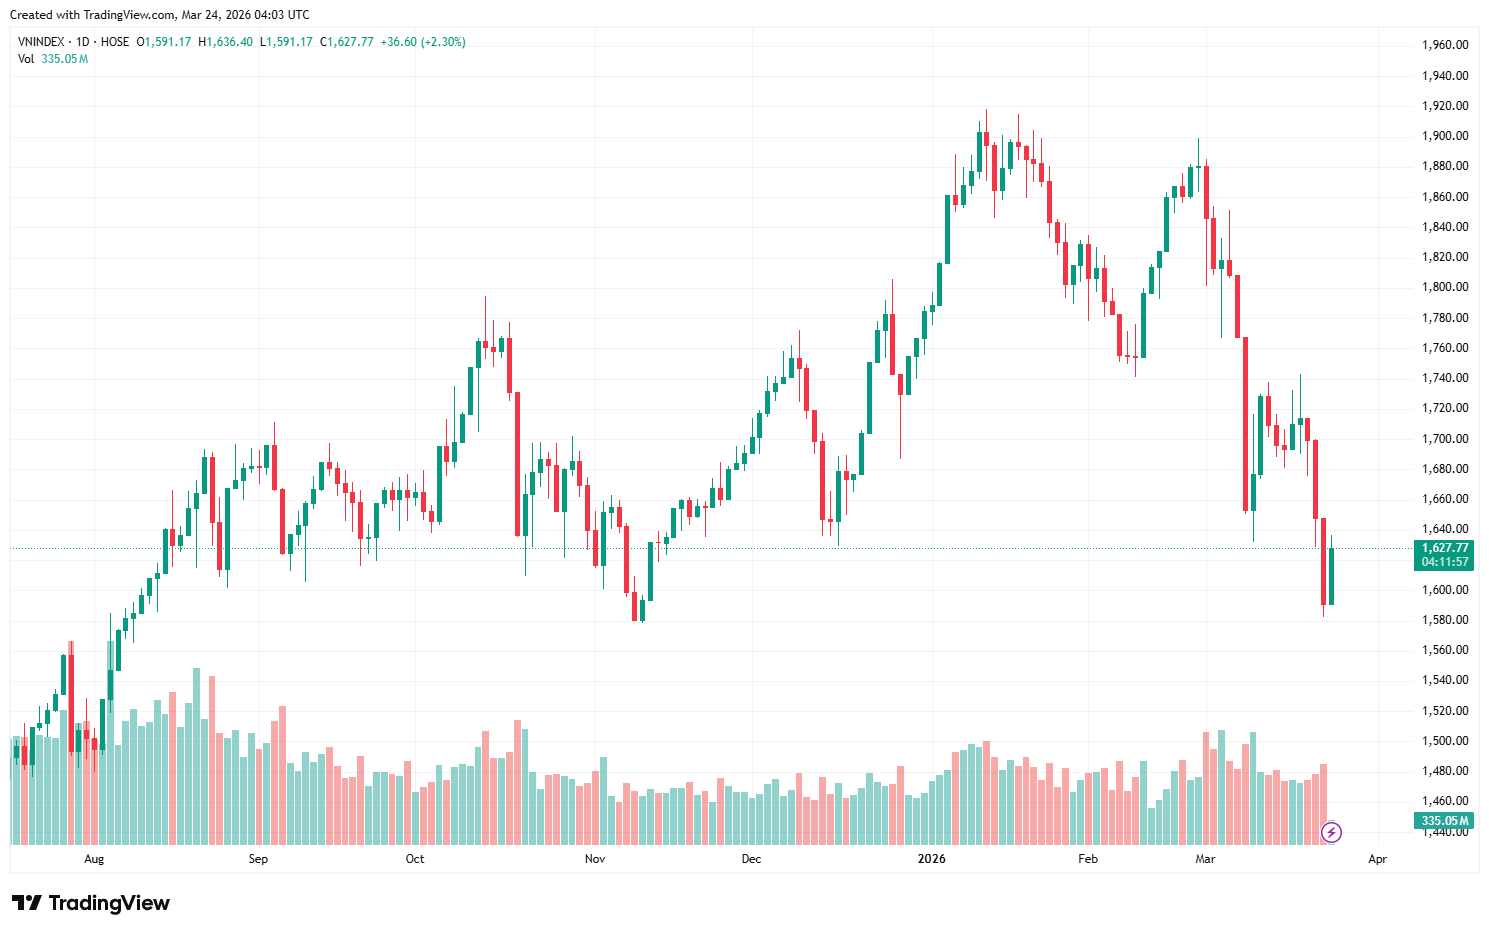
At the close of yesterday's trading session, the VN-Index closed at 1591.17 points, down 56.64 points, or 3.44%. This morning, it recovered but could not maintain sustained rebound.
The VN-Index closed with a Black Marubozu candlestick and retreated to the 1,580-1,600 support zone. On the daily chart, the VN-Index closely followed the lower Bollinger band and lost support at the MA200 line, indicating that short-term momentum continues to weaken.
Although the VN-Index is currently in the strong support zone of 1,580-1,600 points, the RSI and MACD indicators are moving below the oversold zone and show no signs of slowing down. Therefore, if the VN-Index fails to hold the above-mentioned points, the nearest support areas should be considered, at 1,500-1,550 points.
On the hourly chart, the movement of key indicators such as RSI and MACD is consistent with the daily chart, both remaining below the oversold zone. In addition, the Ichimoku red cloud continues to move lower, indicating that market momentum remains under significant pressure in the short term.
Amidst the general correction in global stock markets, the VN-Index was also strongly affected, continuing to record a nearly 60-point decline with red dominating. Given the current situation, VCBS recommends that investors remain calm, closely monitor market movements, and review their portfolios by maintaining a high proportion of stocks with sideways trends consolidating their price levels while reducing leverage and restructuring portfolios with stocks that have broken through key support zones.
“Investors can look for stocks showing signs of slowing down after a sharp correction and exhibiting renewed interest from investors, waiting to invest when the overall market shows clear signs of equilibrium," said VCBS.
Author: NGOC ANH
RECOMMENDED TOPICS