
 VN
VN
 EN
EN
22/07/2026, 02:38
Investment
Stock Market Weekly Forecast: Downward trend may continue
With last week’s developments, the Vietnam stock market's downward trend may continue this week, accompanied by some intraday technical rebounds.
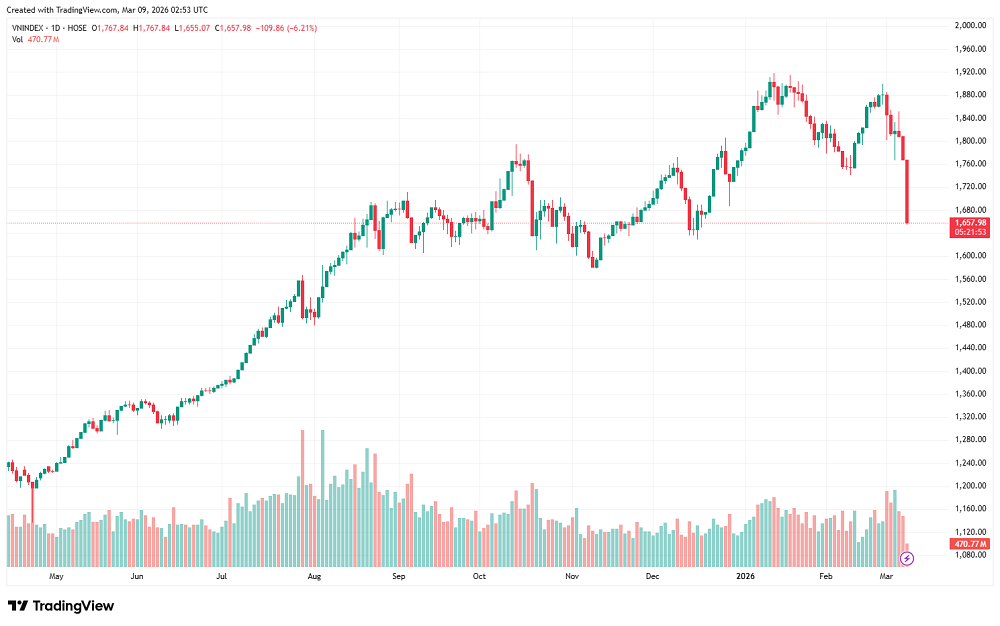
For the week, the VN-Index decreased by 112.49 points (-5.98%) compared to the previous week.
During the trading week of March 2-6, the VN-Index recorded a sharp decline of over 110 points, erasing almost all the gains of the previous two weeks. Fluctuations in armed conflict in the Middle East were one of the main factors affecting market sentiment in the last week. Negative movements in most large-cap market sectors, such as Vingroup, banking, retail, and technology, put significant pressure on the index, causing it to continuously slide towards its previous lows in the 1,750-1,770 range.
However, some sectors benefiting from geopolitical instability, such as oil & gas and fertilizer, recorded relatively positive movements compared to the rest of the market. Market liquidity of the last week saw an increase, with total trading volume rising by approximately 35% compared to the first week after Tet (Lunar New Year). Foreign investors continued to be a negative factor, with a net selling volume of VND 3,500 billion last week, concentrated on stocks such as FPT, VNM, and VHM.
Opening the trading session on March 6th, the market faced significant downward pressure and fell to 1,780 points within the first 30 minutes of trading. However, selling pressure gradually eased, and buying activity became more vibrant, helping the VN-Index significantly narrow its decline and close to the reference level by the end of the session.
Besides the positive performance of some blue-chip stocks like VHM, VIX, and SHB, which helped support the market, the bright spot of the session belonged to the oil, gas, and chemical sectors, with representative stocks such as PVT, BSR, DGC, and DCM. In the afternoon session, increased selling pressure prevented the VN-Index from holding above 1,800 points, causing it to fall sharply and create a new low for the week.
The total trading value on March 6th reached VND 27 trillion, a slight decrease of VND 4 trillion compared to the previous session. The afternoon correction pressure mainly came from large-cap stocks, with key stocks being VIC, GAS, and GVR. At the close of trading, the VN-Index closed at 1,767.84 points, down 40.67 points, or 2.25%. For the week, the VN-Index decreased by 112.49 points (-5.98%) compared to the previous week.
The VN-Index closed the week with a Black Marubozu candlestick, approaching the 1,750 support level. On the daily chart, the RSI indicator is trending downwards, in line with the MACD, which is retreating and widening the gap between the two signal lines. The CMF indicator is also officially trending downwards and retreating to its nearest previous low. The VN-Index is trending towards retesting support around the nearest previous low, equivalent to the 1,740-1,750 point range. Market reaction at this level will be needed to determine the strength of the downtrend in the coming sessions.
On the hourly chart, the VN-Index continues to retest the support zone at the lower boundary of the Bollinger Band. The RSI indicator has turned downwards towards the oversold zone. With this development, the market's downward trend may continue in this week, accompanied by some intraday technical rebounds.
Last week's trading session ended with a dominant red color (237 stocks in the red and 88 in the green). Throughout the week, despite signs of active buying, the continuous supply pressure prevented the VN-Index from narrowing its decline, putting significant pressure on the market.
Given the escalating global geopolitical instability, VCBS recommends that investors review and restructure their portfolios by taking profits on stocks that have reached their targets to protect gains, while continuing to closely monitor market developments and only making new investments when the market shows signs of rebalancing or forming a clear bottom and trend reversal.
Author: NGOC ANH
RECOMMENDED TOPICS