
 VN
VN
 EN
EN
26/07/2026, 02:00
Investment
Stock Market Weekly Forecast: Investors should proactively restructure their portfolios
Investors should proactively restructure their portfolios, selling off stocks that are trending weaker than the VN-Index, and only maintaining a significant weighting in stocks that continue to attract cashflow.
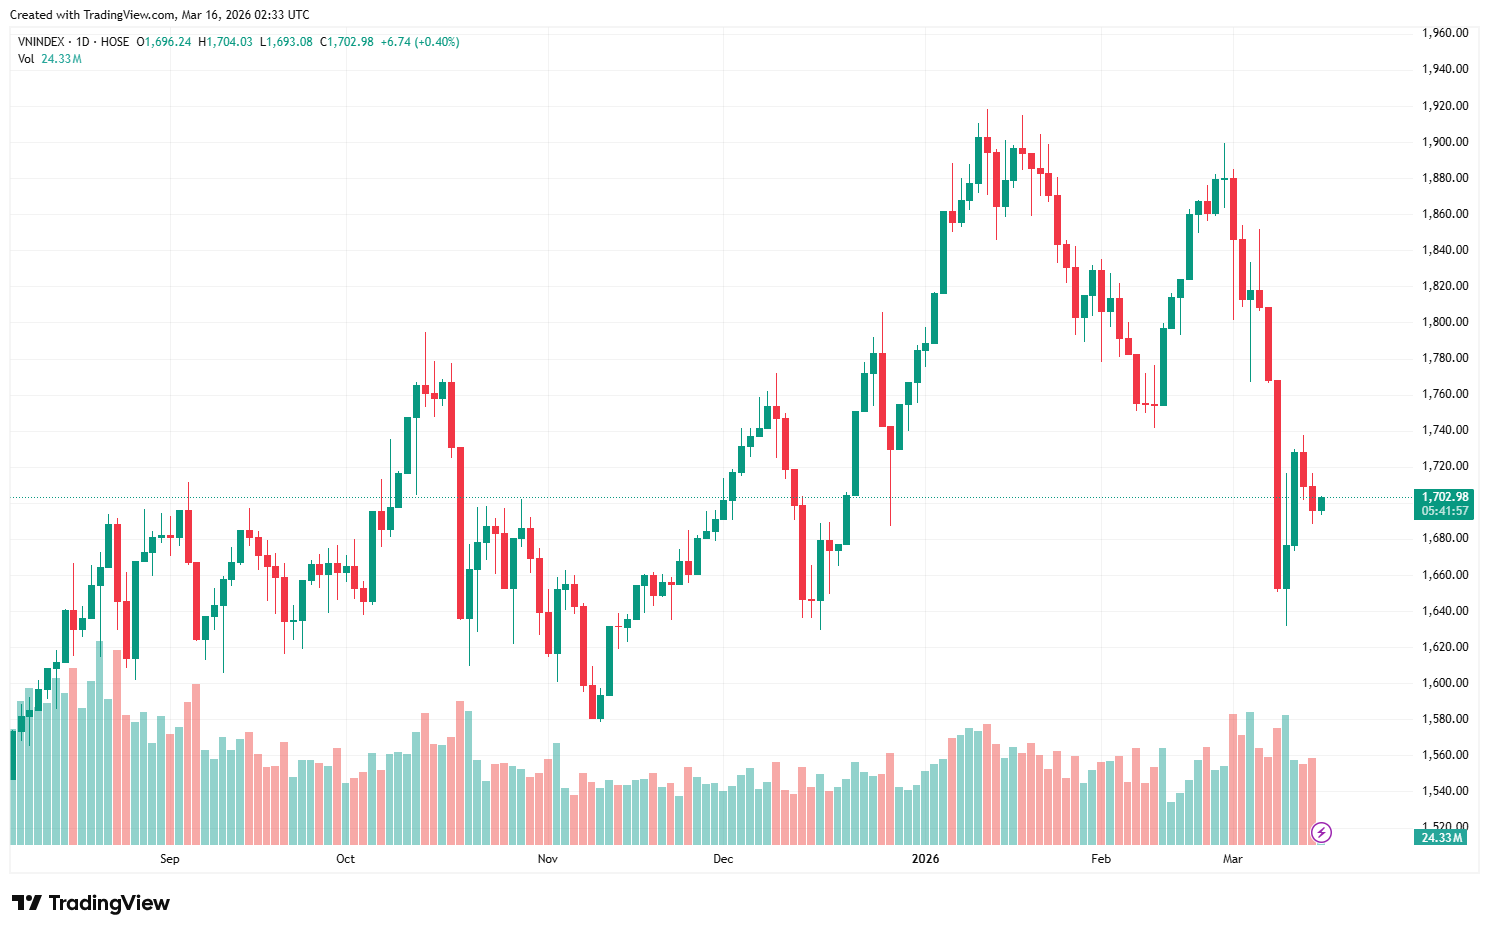
The VN-Index closed the last week with a Doji candle around the 1,700 level.
During the trading week of March 9-13, the VN-Index recorded a sharp decline from the beginning of the week, losing 155 points and falling to the 1,650 level due to investors’ concerns about the Middle East conflict leading to a sharp increase in oil prices.
Widespread selling pressure caused most stocks on the market to hit their lower limit on March 9. However, bargain hunting and active buying liquidity gradually returned, targeting stocks with promising Q1 earnings results in sectors such as retail, banking, and chemicals, helping the overall index narrow its decline and recover to 1,700 points.
Opening the trading session on March 13th, the market faced selling pressure from the start of the morning session, with more than half of the large-cap stocks in the VN30 index falling, causing the VN-Index to briefly drop below 1,700 points. However, differentiation remained evident, with active buying liquidity still targeting individual stocks in sectors such as construction, oil and gas, and chemicals, which helped the market narrow its decline and even regain positive momentum at times.
In the afternoon session, the strong surge in active selling pressure wiped out the VN-Index's recovery efforts, causing the VN-Index to quickly fall and close below 1,700 points. At the close, the VN-Index stood at 1,696.24, down 13.37 points, or 0.78%. For the week, the VN-Index fell 71.60 points (-4.05%) compared to the previous week.
The VN-Index closed the last week with a Doji candle around the 1,700 level. On the daily chart, the MACD indicator continues to trend downwards but is in the strongly oversold region, approximately -30. Furthermore, the VN-Index is quite far from the MA20 moving average, suggesting a high probability of a technical rebound with the nearest resistance around 1,750 points.
On the hourly chart, most indicators show a neutral trend, but the CMF indicator is still rising, indicating that active buying liquidity is increasing in the short term and has not yet withdrawn from the market.
Given the current developments, VCBS recommended that investors with a high cash ratio patiently wait for clearer signals from the market. Investors should proactively restructure their portfolios, selling off stocks that are trending weaker than the VN-Index and only maintaining a significant weighting in stocks that continue to attract capital and hold strong support levels, as well as those with sideways/accumulation trends in sectors such as banking, retail, and chemicals.
Technically, the VN-Index has yet to break out of the range of the sharp bearish candlestick on March 9th. The nearest resistance zone is around 1,750-1,800 points, while support has been raised to around 1,640 points.
“Investors should monitor market reactions at support and resistance levels and avoid excessive enthusiasm during rallies with unclear trends. Notable sectors include fertilizers and utilities," said PHS.
Author: NGOC ANH
RECOMMENDED TOPICS