
 VN
VN
 EN
EN
26/07/2026, 02:00
Investment
Stock Market Weekly Forecast: Signs of slowing down at 1,750 points
The Vietnamese stock market is showing signs of slowing down at the 1,750 resistance level with clear divergence in performance.
This morning, the VN-Index fell by 0.57% to 1,740 points with many stocks in downtrend
During the trading week of April 6-10, the VN-Index recorded a recovery of over 100 points from the 1,665 level and reconquered the 1,750 resistance level in the final sessions of the week. The main driving force behind the VN-Index was the FTSE announcement of upgrading the Vietnamese stock market to emerging market status (officially effective in September 2026).
In addition, the easing of conflict in the Middle East also contributed to stock market stability. Most sectors showed signs of recovery; however, the bright spots included Vingroup, Banking, Real Estate, and Retail.
On last Friday's trading session (April 10th), the VN-Index continued to test its momentum around the 1,750 resistance level. The VN-Index's movement in the morning was characterized by fluctuations of 15 points above 1,750. The highlight of the session was the performance of large-cap stocks, especially the banking sector, with strong gains in TCB, VPB, EIB, LPB, and MSB.
In the afternoon, the VN Index's performance was similar to the morning but showed signs of weakening towards the end due to increased selling pressure. Many stocks also saw their gains narrow, such as EIB, VNM, and VPB. The oil and gas and fertilizer sectors unexpectedly attracted significant capital inflows in the afternoon, with BSR and DCM rising nearly 4%. Foreign investors made net purchases totaling VND 840.62 billion, primarily buying TCB, HPG, and MBB.
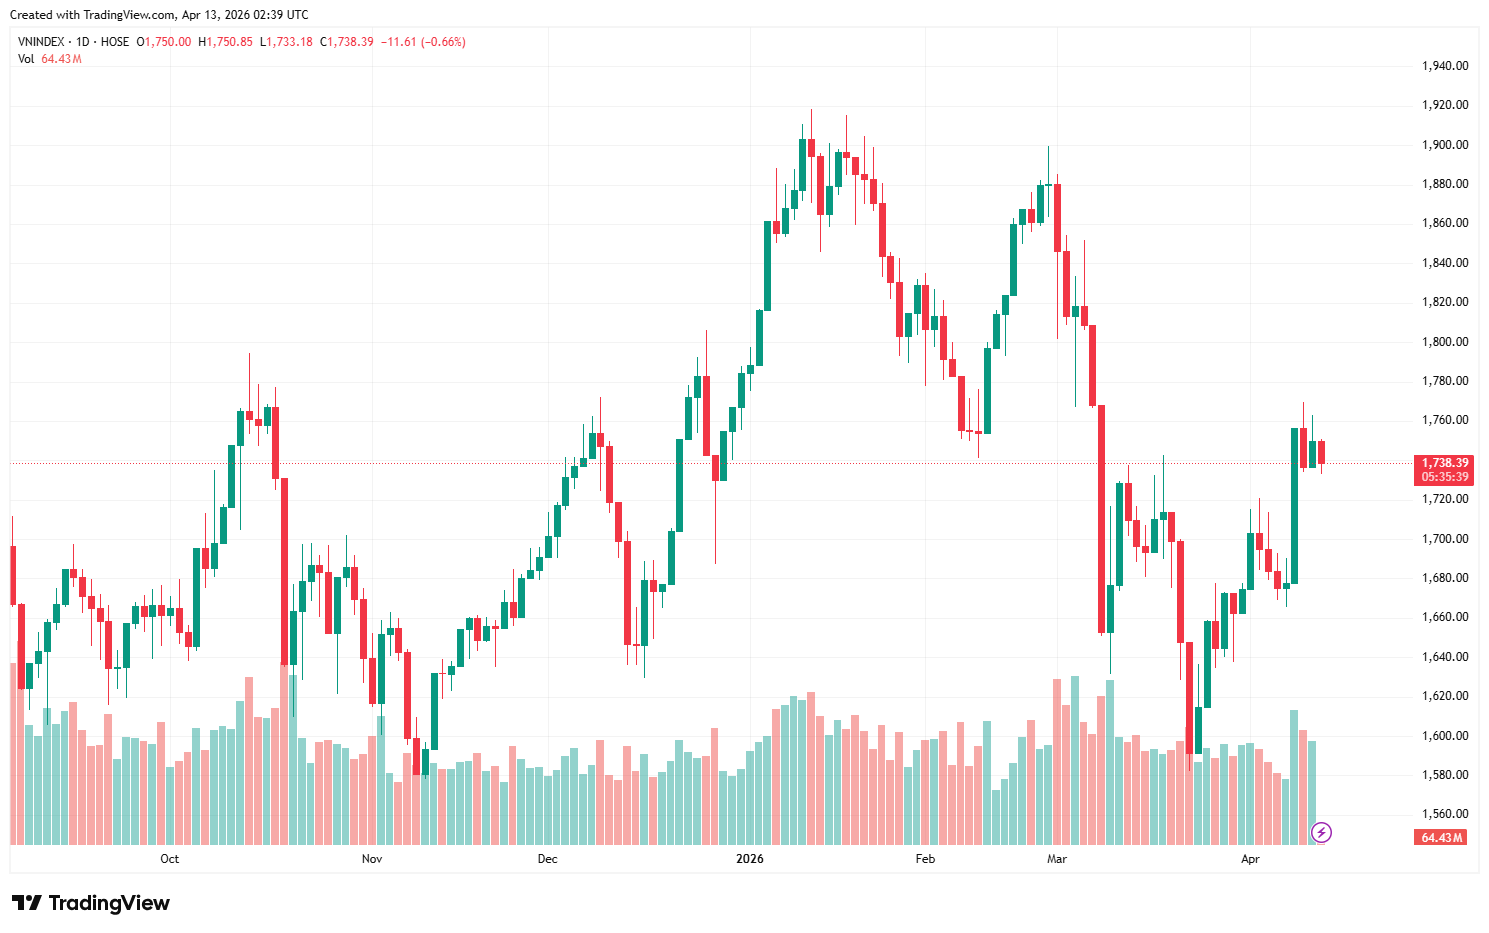
At the close of trading, the VN-Index settled at 1,750 points, up 13.32 points, or 0.77%. For the week, the VN-Index increased by 65.96 points (3.92%) compared to the previous week.
This morning, the VN-Index fell by 0.57% to 1,740 points with many stocks in downtrend, such as ACB, MWG, SSI, TCB,…
The VN-Index closed the week with a Gravestone Doji candlestick due to increased selling pressure in the afternoon session. On the daily chart, the RSI indicator has stalled around 50 and the MACD indicator has not yet crossed the 0 mark, suggesting a high probability that the VN-Index will continue to fluctuate in the first 1-2 trading sessions of the week. However, the VN-Index is approaching the Ichimoku cloud zone, so expectations are that the VN-Index will break through this area after completing the momentum test at 1,750 points.
On the hourly chart, the RSI indicator is forming a negative divergence and the MFI indicator is trending downwards from a high, indicating short-term supply pressure on the market, thus reinforcing the prediction of volatility in the following sessions, with the nearest support at 1,730 points.
The market is showing signs of slowing down at the 1,750 resistance level with clear divergence in performance. However, liquidity has improved compared to last week (5.3%) and cash flow remains quite active, coupled with the reversal to net buying by foreign investors, which helps strengthen the overall momentum in the short term.
VCBS recommends that investors maintain their holdings in stocks that are in a convincing uptrend, while also looking for new opportunities in stocks that show signs of consolidating support or successfully testing resistance, and have expectations of breakthrough Q1 earnings results, and investing during market consolidation phases next week.
Author: NGOC ANH
RECOMMENDED TOPICS